Forecasting WORLD Hunger
When all the data is available, it’s easier to make a map. But what happens when you don’t have all the details? How do you make a map then? It’s a myth that old maps with unknown territory declared, “HERE BE DRAGONS”; they were more likely to mark the area with the milder, “Terra Incognita.” Nowadays, we don’t need either phrase, not when we have AI.
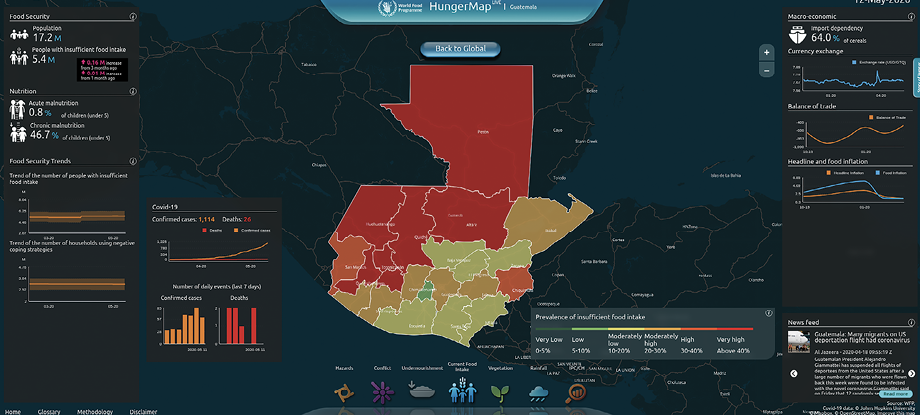
The World Food Programme, a branch of the United Nations, has developed a new application called HungerMap LIVE (hungermap.wfp.org). This map not only shows food scarcity around the world, it establishes estimates for places where not a lot of data is available. You can zoom down to country level, which provides both a color-coded map and a dashboard of information about food scarcity and malnutrition within a country.
 |
| HungerMap LIVE shows the critical situation in Guatemala. |
Overlays provide you with additional information such as rainfall, conflicts in the area (including protests and violence against civilians), and hazards. It would probably be impossible to establish a map like this for all countries without some level of AI forecasting: Countries such as North Korea are not going to be forthcoming with information about malnutrition. HungerMap pulls together both available information and forecasts/nowcasts built by AI and machine learning and puts it into one map crammed with (easily accessible) information.
Mapping Destruction in Historic African American Neighborhoods
HungerMap LIVE is a blend of the known/quantifiable and guesses built on AI. Almost worse than the unknown, however, is the ignored. It happened; there are records; but it’s not talked about. It’s not discussed. No lessons are learned. A map will tell you things about “urban renewal” and African American neighborhoods that you probably did not learn in history class.
If you’re of a “certain” age—maybe about the age where you still know how to fold a paper highway map—you might re member that your history classes in school could be a little … pale. There was Black History Month, and you probably heard about Frederick Douglass and Rosa Parks. You likely didn’t hear about the Wilmington Insurrection of 1898, the 1921 Tulsa Race Massacre, or the activism of Ida B. Wells. And you probably didn’t hear about the things that your state, or city, or even neighborhood did in the 20th century to diminish black communities.
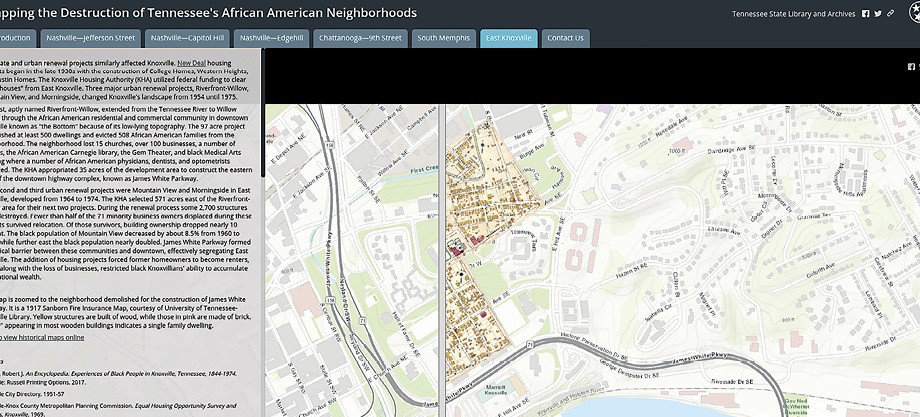
The Tennessee State Library and Archives has developed a set of maps called Mapping the Destruction of Tennessee’s African American Neighborhoods (tnlibarchives.maps.arcgis.com/apps/MapSeries/index.html?appid=8dba65584072450ca8928a5f3408373f) that show the before and after of how urban renewal and the development of a highway system decimated the communities of people of color.
 |
| The Tennessee State Library and Archives developed a set of maps that highlight the destruction of African American neighborhoods. |
Using a combination of text and sliders to compare historic and current maps, the site walks you through how government policy destroyed both neighborhoods and livelihoods in Tennessee cities. The text also notes how this destruction and loss of business impacted African American affluence across time and created areas of implicit, if not explicit, segregation.
Yes, it’s hard to look at and think about. Of course it is. That shows the power of using a map and sliders to make plain what local policies did to non-white communities. Look at a neighborhood in a historic map, move a slider, and it’s gone. Neighborhoods become highways; businesses disappear. The simple act of comparison brings home the change and the destruction with more force and power than 10 pages of description.
Accused Witches in Scotland
This kind of history may not have been covered in school, but it’s there to be seen in the public records and newspapers and, of course, maps. What about when history has been minimized or turned into a source of humor with time? For the last map in our tour of possibilities, let’s look at accused witches in Scotland.
 |
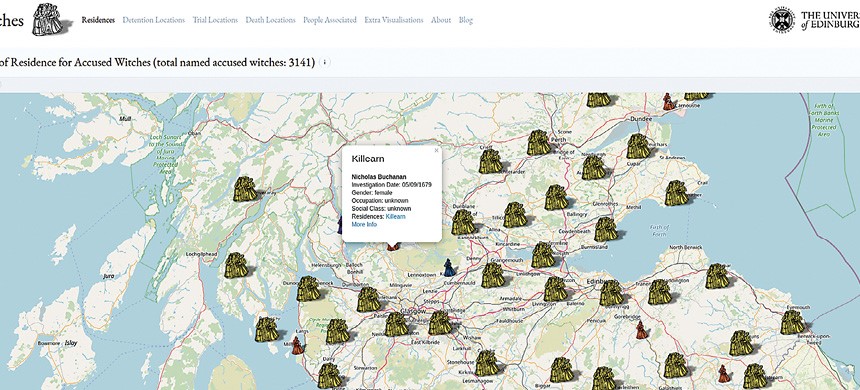
The map of accused witches in Scotland uses icons to represent specific accusations. |
When you think of accused witches, what comes to mind? The Salem Witch Trials? The Monty Python accused witch who allegedly turned someone into a newt? Any one of dozens and dozens of cultural references that make a serious accusation and possible condemnation into a punchline?
History can be ignored, but it can also be rendered non-impactful by what our culture makes of it. Accused witches turn up in cheap horror movies and in comedy sketches. But these were real people, mostly women, who suffered serious consequences from these accusations. The University of Edinburgh has mapped these people via Places of Residence for Accused Witches (witches.is.ed.ac.uk), which includes more than 3,100 people.
The map is filled with icons representing accusations. Click on an icon to get a basic overview, with a link to more information, including where the accused lived and any relevant notes. There are additional links from there to even more information and details from primary sources. There are accusations of white magic, sorcery, and pacts with the devil. This isn’t easy reading, but it’s a sobering reminder that history is history, no matter what we try to make of it in later generations, and it does a disservice to the people impacted to turn their lives into a joke.
RETHINKING MAPS
Physical maps were and are invaluable for getting you from point A to point B. Digital maps go a step beyond that. They can guide you through history, culture, and problems of the future. They can be an alarm for upcoming problems or a revelation of history. We’re still in the early days of the internet as a vehicle for building digital maps. I expect they will continue to evolve, become more complex, and encompass and explore all aspects of humanity and culture.