|
EDTECH
Leveraging Earth Observations for Education
by Hilary Peddicord, Susan Cobb, and Beth Russell
| Theyre animations of dataobservations of the ocean, the atmosphere, space, and land collected by satellitesand the output of numerical models used by scientists to predict and monitor the Earth and space. |
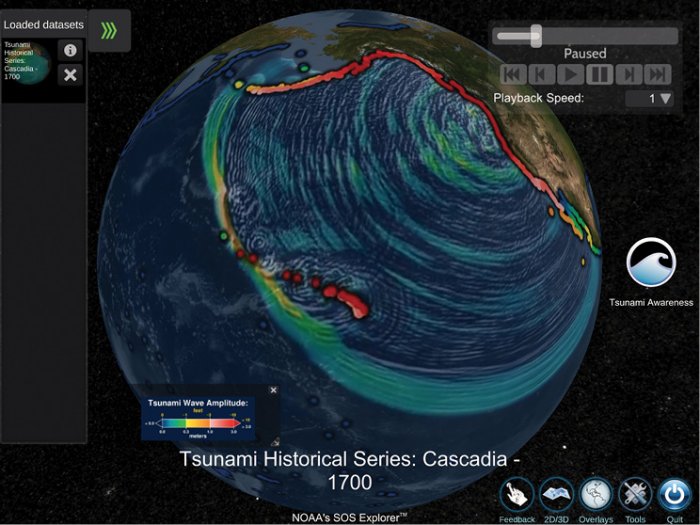
An enormous earthquake triggered a tsunami on the northwest coast of the U.S. in 1700. The giant wave rippled across the ocean, bounced back and forth off islands, and flooded coastlines around the Pacific to different heights. The astonishing patterns of waves reflecting and refracting across the vast basin are almost too complex to visualize. Now, a new free app can bring the power of this earthquake to life on your smartphone.
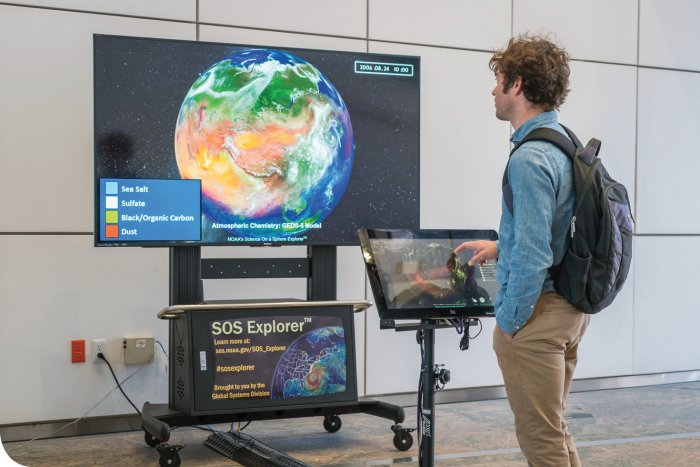
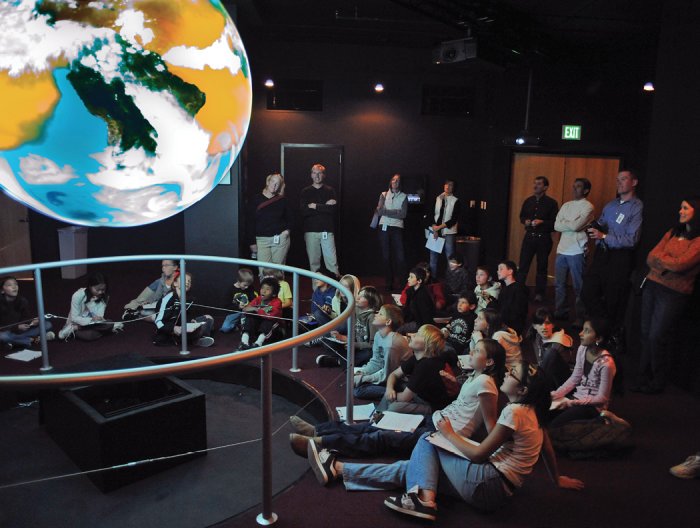
This new SOS Explorer Mobile (SOSx Mobile) app comes from a long line of visualization tools from the Global Systems Division (GSD) of NOAA’s Earth System Research Laboratory (ESRL), beginning with Science On a Sphere (SOS) in the early 2000s. SOS is a 6-foot animated globe now installed in more than 165 museums, science centers, universities, and other educational facilities. A cornerstone of the SOS project is an extensive data catalog with more than 500 visualizations custom-made for display on the sphere. The SOS team wanted to extend the reach of SOS beyond a place to visit and into the hands of students and teachers. They began experimenting with desktop applications and then mobile apps. The result is SOS Explorer (SOSx) and SOSx Mobile, which take the datasets shown on SOS and make them available on flat screens and mobile devices.
The SOSx Mobile app tells Earth and space science stories by playing visually stunning movies on a virtual globe. However, these aren’t your typical movies. They’re animations of data—observations of the ocean, the atmosphere, space, and land collected by satellites—and the output of numerical models used by scientists to predict and monitor the Earth and space.
The GSD, located in Boulder, Colo., created SOSx Mobile using Unity, a development platform for 2D, 3D, and virtual reality (VR) applications, as well as a streaming technology similar to Netflix. For example, depending on the strength of your internet connection and technical specifications of your device, the data may stream in high resolution or low resolution. “Increasing accessibility to our vast data catalog has been a goal of ours for so many years. We hit 10,000 downloads of the app in the first week after the release,” says co-author Hilary Peddicord, the education specialist on the SOSx team.
HISTORY OF SOS, SOSx , AND SOSx MOBILE
The original SOS team experimented with beach balls and desktop projectors before leveraging low-cost, commercial components to create the first proof-of-concept SOS. The initial prototype was developed in 2001 using an Apple G4 computer with four video cards, low-end video projectors, and an acrylic sphere. The early system had a low resolution of 400x400 pixels, a slow video frame rate, and difficulties mapping and synchronizing images on the sphere. Despite these issues, the compelling visualizations convinced other NOAA organizations to invest in the project. While much has changed, the initial concept of four projectors positioned in a square around a sphere that project Earth and space science visualizations onto SOS has remained the same.
In 2002, a traveling SOS prototype was built and deployed to several venues, including a local school, where it was tested by 500 students. The first permanent SOS installation was at Seattle’s Science Fiction Museum (now the Museum of Pop Culture) in 2004.
Since then, the research team has improved the system by creating additional datasets to display on the sphere; increasing the pixel resolution used by the display system; improving the focus, convergence, and overall quality of the projected imagery; creating a user interface to control the system; and developing more portable and scalable construction techniques for the sphere itself. Innovative researchers built SOS from standard hardware components, including off-the-shelf PCs, video projectors, and cables. The original sphere was made of PVC and weighed 240lbs. The current 6-foot-diameter carbon fiber sphere weighs 45lbs.
Most venues install SOS suspended from above, with four external video projectors mounted at the corners of the room. Where a suspended SOS is impossible, a massive truss provides the structure to hang the sphere safely.
SOS data visualizations are pulled from a local storage disk, manipulated, re-projected, and synchronized onto the sphere with projectors. Initial SOS deployments required six computers—one for each projector, one to sync the four projector computers, and a spare. With better video cards, in 2010, the team reduced the equipment requirements to one operational computer and one spare.
Key to the success of SOS was aligning the projectors to create the appearance of one seamless image. At first, the team used very sensitive projector mounts, precise positioning, and the projectors’ zoom feature to align the images. Later, they wrote custom software so that technicians could manipulate the projected images to ensure perfect alignment. In 2015, the team introduced computer vision to align the projectors automatically.
At first, SOS presentations required two people—a driver to load datasets and play the animations and a presenter. In the early 2000s, a radio frequency television remote allowed the presenter to operate the system alone. In 2008, a Nintendo Wii remote gave presenters a more responsive tool and allowed greater distance from the control computer. An SOS Remote App for the Apple iPad gave the 2011 presenter access to the entire data catalog and the capability to zoom in with a magnifying glass, draw on the sphere, place icons, layer datasets, and access dataset descriptions and presenter notes.
With these advances, the team marketed the SOS technology to a broad network of learning institutions, making the visualizations available to millions of viewers. By successfully managing this network and disseminating content and improvements, this team has made SOS one of the most effective tools for bringing NOAA data to the public.
The SOS Users Collaborative Network was formed in 2007 as more museums became interested in SOS. More than 10 years later, the network is still going strong, with original and new members working together to advance the use of SOS in informal education settings.
An educator joined the team in 2010 to ensure that SOS was developing in a way that was beneficial to museums and schools. Teacher workshops and webinars allow the team to stay in touch with users and incorporate their suggestions into the SOS software. Teachers were eager for ways to incorporate the rich datasets and scientific visualizations in the SOS catalog to supplement their science lessons. However, a 6-foot animated globe was not practical for a classroom, so the innovative SOS team responded with a digital globe on an affordable, portable flat screen: SOSx.
The groundbreaking SOSx software uses video game technology to make the visualizations more accessible to schools and museums with smaller spaces. SOSx is interactive and includes tools to measure, probe, and plot data from visualizations; 4K resolution graphics; tours through datasets; educational videos; and an SOSx Tour Builder. SOSx currently has more than 150 datasets.
In June 2017, the team released new software for SOSx that uses Oculus’ Rift VR technology to immerse viewers in 3D datasets. With the Rift headset, users can explore the rings of Saturn and the Hubble Space Telescope’s orbit, as well as view a 3D rendering of the aurora borealis as seen from the International Space Station. With virtual fingers, users can select SOSx datasets, move the globe in any direction, and toggle between different views.
The SOSx software requires a gaming computer with adequate graphics and computing power. The exhibit provides stunning visualizations and valuable learning opportunities. Even though a variety of K–12 schools, museums, and universities enjoy learning with SOSx technology, there were still barriers in getting the visualizations into the hands of teachers, students, and the public.
SOSx MOBILE
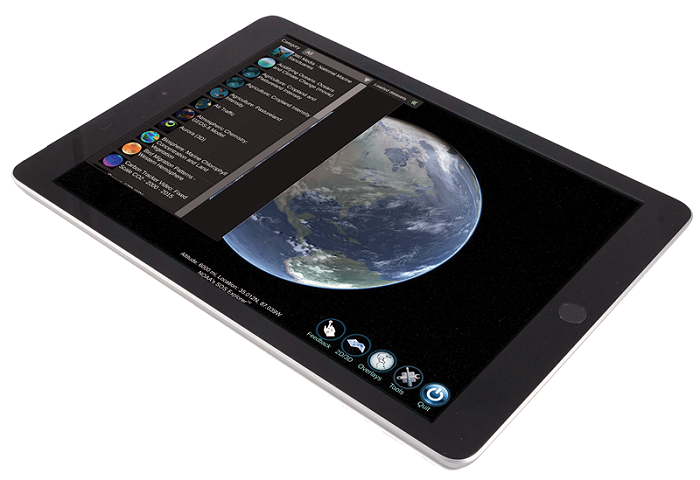
After more than a year of development and testing, researchers released the free SOSx Mobile app in August 2019 to the Apple App Store and the Google Play Store. The goal behind the app is to get the scientific visualizations into the hands of as many people as possible—especially teachers and students—in a format they can use. There are 120 datasets available for the app so far, including narrated movies. Users can analyze the data with built-in tools and dig into other included resources.
SOS DATA CATALOG
Without data, SOS is simply innovative technology. The extensive data catalog continues to drive the success of SOS, SOSx, and SOSx Mobile, with more than 500 data visualizations organized into categories such as land, water, air, and space.
Every dataset has its own story of how it came to be. SOS educators curate datasets provided by scientists from NOAA, NASA, and other institutions. The visualizers do the hard work of converting raw data into the beautiful SOS datasets that you can see. For example, some of the most popular datasets in the SOS catalog are near-real-time animations of satellite imagery of clouds, sea surface temperatures, and ice cover. Many of these are from NOAA’s National Environmental Satellite, Data, and Information Service. The satellites collect massive pixel matrices of numbers as well as measurements of wavelength bands that the instruments can detect. Once the data has gone from raw to calibrated and has been (sometimes) rebroadcasted, analyzed, and converted to geographic and colorful image tiles, it is ready for the suite of SOS products. The SOS team then makes them accessible to the public through an FTP server that syncs to all the sites that have SOS, SOSx, and SOSx Mobile. The current data catalog is just the tip of the iceberg, and the team invites anyone to contribute.
USING SOS AND SOSx IN THE CLASSROOM
The SOS catalog now offers phenomena-based learning modules that begin with an attention-grabbing image or video clip to hook students into the experience. The strategy invites questions about complex ideas and draws on multiple areas of science to help answer them. For example, The Tortoise (Not Turtle!) That Crossed the Indian Ocean targets 6th–12th graders with a wacky story about how a giant land tortoise floated 450 miles from the Seychelles to Tanzania. The story explores the differences between tortoises (who generally don’t swim) and their cousins, sea turtles, who make long migratory journeys across the oceans each year. The lesson also probes how sea surface currents, wind patterns, and monsoon seasons impacted the tortoise’s route. Phenomenon-based learning aligns with the Next Generation Science Standards (nextgenscience.org).
TRY IT TODAY
With the arrival of SOSx Mobile, anyone with a mobile device and a good wireless connection can explore the SOS data catalog. Let your library patrons know, and try it out for yourself.
SOS Explorer and Science On a Sphere are registered trademarks.
|


![Science On a Sphere at the NOAA headquarters in Silver Spring, Md. [Photo credit: NOAA]](SOS_NOAA_headquarters.jpg)