| Generally,
when individuals think about patent information they conjure up an image
of a diligent searcher, poring over reams and reams of information, looking
for the one reference out of hundreds, maybe thousands, that will satisfy
their client. The idea of searching for a "needle in a haystack" comes
readily to mind when referring to the activities in which these professionals
commonly find themselves. More recently, however, information professionals
find themselves being asked to look at the bigger picture. Instead of trying
to identify a single grain of sand on a vast beach, business decision-makers
more and more ask information professionals to identify trends and provide
general overviews to put information in context when compared to a much
larger collection of materials. Instead of finding a needle in a haystack,
today's searchers are becoming analysts and being asked to identify haystacks
from space and then forecast whether the haystack is the beginning of a
new field or the remainder from last year's harvest.
The title of this
article introduces the notion of "patinformatics." This term is borrowed
from the more common fields of bioinformatics or cheminformatics. For example,
by definition, bioinformatics is the science of analyzing large amounts
of biological data using computational methods. For example, researchers
use genomic data to discover relationships or trends between different
genes or biological pathways when looking at smaller datasets could mean
missing a connection. In a similar fashion, the term patinformatics describes
the science of analyzing patent information to discover relationships and
trends that would be difficult to see when working with patent documents
on a one-on-one basis. The term encompasses all forms of analyzing patent
information, including the following:
-
Patent intelligence
The use of patent information to identify the technical capabilities
of an organization and the use of that intelligence to develop a strategy
for strategic technical planning
-
Patent mapping Sometimes
described as white space mapping, which uses published patent data to create
a graphical or physical representation of the relevant art pertaining to
a particular subject area or novel invention
-
Patent citation analysis
the study of patent citations for potentially determining a patent's
value or, perhaps more reliably, the identification of potential licensing
partners or leads based on the citation of an organization's patents by
another company in the same or a completely different market space
Patinformatics can
also cover additional applications of patent information involving a subsequent
analysis step. The key underlying property in each of these diverse areas
is the analysis step. This article will focus primarily on the basic principles
of patinformatics and will survey the field of tools, resources, and Web
sites that have evolved in this space over the last few years.
One might imagine
that the same rules which apply to conducting patinformatics also apply
to patent searching. This is not entirely the case. Just as in physics,
in which quantum mechanics outline the principles for understanding the
microscopic world, while Newtonian principles apply to the macromolecular
world of large bodies in motion, one can distinguish two different approaches
to patent information. Traditional patent searching deals with the micro
level, in which very small changes become extremely important and details
and precision are imperatives. Patinformatics, by comparison, deals with
thousands or tens of thousands of documents and, since small details will
not be seen across such a vast landscape, takes a more macroscopic view
of the data, using different methods and reaching different conclusions.
The difference
between patent searchers and analysts is one of perspective. Searchers
are trained to find a needle in a haystack, while analysts want to identify
haystacks from space. A comparison of the two approaches can illustrate
how each practitioner will deal with the search, review/analysis, and final
presentation of the data discovered. This description is only an example.
I do not claim, by any means, that all patent searches (or searchers) perform
these functions in the exact way described. This section simply illustrates
how to employ a different approach to data gathering when doing analysis
vs. focused searching.
Searching
The greatest difference
between patent searchers and patent analysts occurs in how they approach
a search. Patent searchers are generally concerned with absolute precision,
sometimes at the expense of recall, especially with regards to data that
is of a cursory interest to the subject of the search. Patent searchers
will go to great efforts to find the exact references needed by their clients.
Identifying a single document can sometimes be the goal of their search.
In fact, finding no documents at all may constitute a satisfactory result.
It is not uncommon for a searcher to spend days, weeks, or even months
working on a single search, looking for a particular piece of information.
Their search strategies will often be extremely complicate, involving large
keyword hedges and the extensive use of database-specific indexing codes.
Starting with a large collection of data, the searcher will progressively
add layers of detail to the search in order to specifically narrow a dataset
down to those on-target answers most likely to interest their clients.
By comparison,
a patent analyst may also put together a complicated search strategy and
try to be as directed as possible in their searching, but generally want
to create a comprehensive dataset for use as the basis for subsequent analytical
steps. Analysts will also use large collections of keywords and database-specific
indexing, but they will more likely keep their strategies broad rather
than narrowing results to a fine point. As long as the data discovered
is more or less on target, leaving some irrelevant answers in the set may
not bother them, since small inconsistencies will not be seen above the
base line. Statistically speaking, analysis requires the presence of enough
data to discover trends and relationships, so patent analysts prefer an
overabundance of data as opposed to a lack of it. Making the search too
specific may bias the data. It is important to let the data speak for itself,
as opposed to having the analysis directed by the searcher's preconceived
notions while building the dataset.
The single most
difficult task for searchers to overcome as they start doing patent analysis
may be learning to adjust their natural tendency toward directed, specific
searches in order to produce datasets free from bias and subjectivity.
Under these circumstances, datasets may grow to several thousand records.
Searchers will ordinarily stay away from datasets this large, since previously
working with so much information was difficult for end-users to grasp.
Using computerized analytical tools, however, working with large datasets
has become much less complicated and should not deter an aggressive search
strategy.
Review/Analysis
Philosophically,
the differences between patent searchers and patent analysts in the data
review and subsequent analysis phases are not as dramatic as in the searching
phase. Searchers will typically review the document set that they've created
before they package and send the information to an end-user. The searcher
may simply take a quick glance at the data, looking for obvious false drops
which can be deleted without fear that the client would miss them. In the
same fashion, answers absolutely on target may be pulled from the remainder
of the dataset and set aside for prominent placement in a different section
of the search report. With large document sets, say 100 to 500 documents,
the searcher might manually scan a list of titles and mark documents that
they consider relevant to the needs of the client. The analysis aspect
comes from the searcher's familiarity with the subject matter and their
level of understanding client needs.
Under these circumstances,
it is important that the searcher has spent some time with the research
team and has a clear understanding of the technical aspects of the project.
The more familiar the searcher is with the needs of the client and the
technical specifications of the project, the better job they will do in
selecting appropriate documents. The analysis in this case is a judgment
call on the part of the searcher in evaluating what information the end-user
would find more relevant. Depending on the sensitivity of the project,
the searcher may have more or less flexibility in practicing their good
judgment. Some clients will simply ask the searcher to send the results
without any review at all, while others will expect the searcher to screen
the majority of the answers and send only the top answers for their perusal.
In the case of searchers, the analysis and review are usually conducted
as a single step.
A patent analyst,
on the other hand, will look at review and analysis as separate steps with
different objectives and methods. The analyst has to look at the review
step as if they're building a data warehouse, examining the integrity of
the data and making certain that it is clean. The first part of this may
in fact involve a relevance review not dissimilar to the one conducted
by a searcher, only not as detailed and eliminating results widely off
topic. Once again, precision is not the issue here, so the review process
goes fairly quickly. After the analyst is more or less convinced that they
have accrued data generally on topic, they begin the process of building
the data warehouse. Thistypically involves importing the data into a software
tool and checking to make sure that the process has gone smoothly and that
the data is ready for the subsequent analysis phase.
The analyst will
scan the data warehouse, occasionally taking samples of the data, looking
at it, and making certain the information has ended up in the proper fields
and formatted correctly. Depending on the size of the dataset, this process
may take quite some time. A few hundred documents may go quickly, but when
the dataset expands to include several thousand documents, this can become
very time consuming. After building the data warehouse, the review process
is complete and the data analysis can begin. Specific details on performing
patent analysis will be discussed in a subsequent section. The process
has a great deal to do with having a clear understanding of the business
objective and desired use of the intelligence produced by the analysis.
It is less a judgment call based on the analyst's understanding of the
subject matter, as it is an experiment with conclusions drawn based on
the results.
Presentation
Finally, searchers
and patent analysts will present results back to their clients in dramatically
different fashion. The main work product from a searcher is a collection
of references or patent documents. Their search report will typically provide
an overview of the objective of the search, the methods used to conduct
the search, the databases used, the time coverage of these same databases,
and finally, the references themselves. The report may classify results
in different sections based on relevance, document type, or date of publication.
Based on how much relevancy analysis the searcher can provide, the report
will reflect the professional skill of its creator.
When patent searchers
present large collections of results, sometimes reports end up looking
like raw data dumps. The end-user is left to wade through hundreds or perhaps
even thousands of documents, all in reverse chronological order, without
any way to distinguish the 5th answer from the 535th one. End-users may
find it difficult to identify trends or patterns within the data, having
a different perspective when looking at the 100th record than they did
when looking at the 4th. It is also difficult for the human brain to keep
track of several variables while examining hundreds of documents. A computer,
on the other hand, can objectively weigh a set of variables, regardless
of which document they came from, and identify patterns within the data.
The analyst will
typically have a number of computational tools available at their disposal
designed to identify patterns and trends from their experiments. Information
when analyzed becomes intelligence. Intelligence is the main work product
from an analyst. Instead of delivering information, patent analysts will
experiment with the data provided, draw conclusions based on analysis,
and provide those conclusions to a business decision-maker. Analysts are
generally much more integrally involved in the decision-making process
and are seen as consultants rather than as intermediaries. In most cases,
business decision-makers do not want a large collection of data. They want
data to be compiled and analyzed, with different scenarios and their corresponding
advantages and challenges laid out so the decision-makers can draw rapid
conclusions and act on them. The analyst's results, therefore, are generally
a few slides outlining the business need, the hypothesis under investigation,
the results of the analysis, and, finally, some opinions on the potential
conclusions of following different courses of action.
Having worked in
both of these positions, I do not intend this comparison to imply that
one role is more important or requires more intelligence and ability than
the other, but simply to characterize the differences between the two roles
and provide some insight to those individuals who seek to move from one
role to the other.
Patinformatic Principles
When dealing with
the more detailed analysis involved with patinformatics, we can divide
the different type of analyses into two broad categories: data mining and
text mining.
Data mining
involves the extraction of fielded data and its analysis. Normally, this
means analyzing the bibliographic information contained within patents.
For example, someone might want to examine the relationship between patent
assignees and International Patent Classification (IPC) codes for a specific
area of technology. Mining or mapping this information can give an idea
of the major players in a technology area and what type of work they generally
focus on. When using Derwent data, a similar analysis could replace IPC
codes with Derwent manual codes.
Text mining
or mapping typically involves clustering or categorizing documents
based on the major concepts contained. The data source is unstructured
text, it is not fielded, and the only structure within the material comes
from what the author applied when writing the document and how they built
relationships between different concepts and ideas. For example, you could
collect patents from a specific patent assignee and analyze the text of
those documents. In a cluster map, the software would extract the major
concepts found and create clusters of documents concept by concept. The
software would then visualize these clusters in some fashion, creating
a map. By looking at the clusters created (and subsequently, the documents
themselves, but now with an organized method), you can quickly get a general
idea of the concepts that this organization is working on and how these
concepts interrelate.
Success in either
data or text mining will often depend on the analyst's familiarity with
the data source being analyzed and the methods used to prepare and analyze
the data. A full discussion of the submethods and potential pratfalls of
different mining exercises is, unfortunately, beyond the scope of this
article.
With this general
background, I would like to propose a law for the linear analysis of patent
information. Here components of Trippe's Law of Linear Patent Analysis:
-
Create a tool kit
of patinformatics tools.
-
Understand the business
need. and the need behind the need.
-
The need drives the
question.
-
The question drives
the data.
-
The data drives the
tool.
Create a Patinformatics
Tool Kit
As mentioned earlier,
patinformatics can include patent mapping, citation analysis, co-occurrency
analysis, thematic mapping, temporal visualization, and various other techniques
beyond the scope of this article. Clearly no one tool will accomplish all
of these types of analyses. In order to succeed in the overall field of
patinformatics, the practitioner needs the maximum flexibility to pursue
questions based on business needs; therefore, the patinformatics practitioner
should invest in a collection of tools and resources. This approach can
get expensive quickly. So one must understand the types of questions that
are likely to be asked and arrange for tools that will satisfy the corresponding
analysis needs.
Understand the Business Need
and the Need Behind the Need
When it comes
to starting an ad-hoc project, the analyst will typically start by understanding
as much as possible about the analysis need at hand. As information professionals
well know, it is often difficult to get a client to express their true
need when making an information request. Frequently a client will say,
"We need to know everything about Company Y." As strange as this might
sound, the response to that request ought to be, "No, you don't, and if
you did it would take a forklift to cart in all of the data. It would take
6 months for you to get through all of it. And, in the end, you might not
be any closer to the intelligence you're seeking than when you first started."
In patinformatics
it is absolutely essential that the business need for intelligence is clearly
understood before anything else begins. It is also critical to know all
of the needs behind the need as well. Analysts need to understand how the
data will be used and who will use it. They need to know what type of story
to tell in order to represent their intelligence work in such a way that
the person receiving it will understand it and will stand the greatest
chance of putting it into business practice. While important to all information
professionals, these principles are absolutely essential to analysts. Improper
assumptions made up front about the scope and goal of the project can lead
the analysis astray, producing inappropriate or, in extreme cases, misleading
information in the context of the business decision at hand. The analyst
assumes the role of a trusted advisor in these cases and needs to be as
close to the decision-making process as possible, so they can integrate
a thorough understanding of the business need into their work.
The Need Drives the Question
In a true linear
sense, once the need is understood, then the analyst and client can work
together to formulate questions to supply intelligence that will impact
the underlying business decision. For example, a business may need to gain
additional insight on how the research and development progress works for
a particular company (say Company Y again). In such a case, understanding
what research and development projects Company Y conducts in its 10 different
research facilities in the U.S. becomes an interesting question. Additional
questions might include the following: Where do the inventors on their
U.S. patents live? What patenting topics are closer to basic science? Which
apply more to process technologies? By asking a number of compelling questions
and compiling intelligence on each of them, an analyst can begin to paint
a mosaic of the dynamics associated with the business need. Examining all
the dynamics will lead the analyst to draw conclusions.
The Question Drives the Data
Once an analyst
decides on the questions that need to be answered, they must begin collecting
relevant data, just as a scientist investigates a scientific question.
Referred to as the scientific method, this process involves the formation
of a hypothesis, experimentation to determine the validity of the hypothesis,
and verification of the validity of the experimentation and of the conclusions
drawn based on experimental results. In the realm of patinformatics, the
gathering of data is directly analogous to the idea of preparing an experiment
to support or dispute a hypothesis. Selection of the appropriate tool is
also important to the process.
The Data Drives the Tool
Some questions
require very specific types of data. In these circumstances, the tool selected
must not only allow for the analysis necessary to provide the insight,
but must also work with the data source most appropriate for answering
the questions. Continuing with the example initiated above, if the question
posed asks where the inventors on Company Y's U.S. patents live, then the
data will have to include the inventor's address information, which appears
on the front page of all U.S. patents. Perhaps more importantly, this data
must be available in an electronic format for importing into the appropriate
analysis tool. If a tool cannot handle the data format for the file that
includes inventor address data, than it cannot answer the question.
Once again, it
is important to follow these steps in a linear fashion: Deviation from
this path will lead to a situation in which the questions asked are biased
by the tools available to the analyst. If an organization focuses on a
single analysis tool, than all subsequent analysis may be overshadowed
by the strengths and weaknesses of that particular tool. As the old saying
goes, "If all you have is a hammer, everything looks like a nail."
Another principle
that should be applied during patinformatics exercises is the idea of Actionable
Intelligence. This idea dictates that intelligence is only useful if it
is applied to a business question and more importantly used to make a business
decision. Analysis work should not be done for its own sake. If a report
will simply collect dust on the decision-maker's desk, then it was not
worth doing in the first place. Analysts must not get trapped in the novelty
or cleverness of their work. They must stay focused on creating analysis
that allows the decision-maker to definitively see the various options
available to them and to deliver good enough intelligence on those options
to support a clear and relatively unambiguous decision on a course of action.
When intelligence is applied to a business decision, then it becomes actionable.
A Review of Patinformatics
Tools, Resources and Web Sites:
Items discussed
in this section fall into three different categories: tools (software driven
by an internal corporate server or installed on a client's personal computer),
resources (printed or reference materials that provide static statistics),
and Web sites (analytical devices driven from an external server where
clients typically purchase access to the service on a monthly or yearly
basis).
Tools
Aurigin Systems
Inc.
Aurigin's most
well-established system is called the Aureka IPAM system. IPAM stands for
Intellectual Property Asset Management and, as the name implies, this system
allows you to organize and manage intellectual property (not just patents,
but corporate documents as well). The system contains tools for patent
analysis also as an integral part of smart IP management. While a very
powerful and flexible platform, Aureka is a big-ticket item. There are
substantial costs involved in purchasing a server to run the system and
setting it up to work within an organization. It offers a great deal of
power, flexibility, and security (since it is located behind your company's
firewall), but it will take considerable commitment to establish it.
As an integrated
system, the Aureka platform provides enough flexibility to incorporate
a number of third-party applications to work within the framework. Aurigin
works with or acquires some of the best third-party analysis tools companies
to partner with them and integrate their systems into the Aurigin management
system. Aurigin has incorporated both text and data-mining tools into the
system and set them up so the tools all work together seamlessly.
Aurigin has pre-loaded
its platform with patent data taken from the four major patent authorities
(US, EP, JP, and PCT) and includes a search engine for identifying relevant
references. These references can be saved, creating sets for further analysis
and sharing with colleagues. Another nice feature of the Aureka platform
is the ability to annotate documents. Since Aurigin began life as SmartPatents
Inc., users have all of the annotation and viewing capabilities of SmartPatents
accessible through the system. (In a bold move, Aurigin recently announced
that SmartPatents would be given away to customers who have a subscription
to the system). One of the key strengths of the IPAM system is the ability
for individuals within an organization to create sets of patents, analyze
them, annotate them, generally create intelligence from them, and save
all of this knowledge in a single place.
One of the analytical
tools built into the Aureka system is the ThemeScape thematic, text-mining
tool. Originally marketed by a company called Cartia, Aurigin Systems acquired
it in 2000 and integrated it into the Aureka platform. A detailed description
of how the program works is beyond the scope of this article, but ThemeScape
employs a concept mapping method of creating technology landscapes. The
program reads full-text documents, identifies themes that occur throughout
the references, and employs clustering algorithms to organize documents
by co-occurrence of the identified themes.
ThemeScape organizes
this information by using a topographical map paradigm. In a ThemeScape
map, each document is represented by a black dot; taller peaks are clusters
that contain a higher number of documents on a particular subject; and
the closer two documents appear to one another on a map, the more overlap
they share in their themes. ThemeScape is a text-mining tool with a few
built-in data- mining features that enhance the clustering aspect. It incorporates
a data-mining aspect since you can ask it to identify a specific patent
assignee on a map. This takes the form of small white dots, reflecting
a concept area where that patent assignee is working.
Another analytical
tool within the Aureka platform is the citation tool. Licensed from InXight,
this technology incorporates a hyperbolic tree viewer. The citation tree
tool creates a hyperbolic tree of citation information from within the
U.S. patents covered in Aureka. Select a single U.S. patent and it will
become the root of the tree, with subsequent citations to that document
forming branches moving forward one generation to the next. Backward citations
can also appear visualized in this tree format. One can label trees in
a number of different ways, including by assignee, publication date, or
inventor. Trees can also be colored based on date or assignee. Citation
trees can support a rapid visual review of the citation history for a single
U.S. patent.
This approach has
one drawback: The branches of the citation tree are all formed in a linear
fashion. Relationships between citing documents from one generation to
the next cannot be seen since only linear lines are drawn. If the producers
enhanced the system with the addition of interconnecting lines between
documents that cross generations, this would allow the discovery of documents
that appear to be cited by several different assignees throughout the entire
citation history of the root document.
The Aureka system
also contains a reporting tool that supports statistical analysis of the
patent data. The reporting module is broken into three broad sections:
-
Key summary reports,
which provide the top10 data elements in a particular area such as top
10 assignees or the top10 inventors within a collection.
-
Detailed reports,
which include text-based reports on subjects such as the pace of invention,
citation history, inventor and assignee reports, and matrices such as International
Patent Classification vs. patent assignee reports.
-
Pivot tables, the
most powerful of the reporting models, created from assignee, inventor
of, U.S. classification, citation, and several other data elements. Once
collected, results are exported to Microsoft Excel for the creation of
the table and subsequent manipulation by the analyst. Almost all the bibliographic
fields within the patent are available to the analyst for combining, mixing,
and matching in a pivot table. Incredibly complicated and elegant analyses
can be created in this fashion.
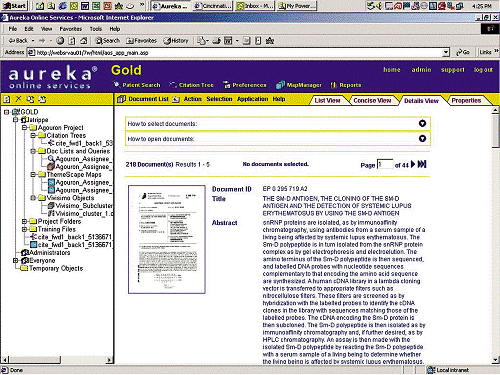
Aurigin recently announced
the creation of an HTML-based version of its platform labeled the Aureka
Online System (AOS) (see Figure 1 on page
33). Available as a fully hosted or on-site model, AOS brings an even more
seamless integration of the management and analysis tools of the Aureka
platform to an increasingly end-user audience. Innovations incorporated
into AOS include licensing of the Vivisimo [http://www.vivisimo.com]
clustering tool for automatic categorization of patent documents, annotation
of not just the documents but also the various data elements themselves
such as the citation trees and ThemeScape maps, and stratification of user
levels based on user analytical needs and training. These levels are designated
Gold, Silver, and Bronze. Gold users have access to all the capabilities
within the system, Silver users have access to just about everything except
ThemeScape, and Bronze users can access the search, view, and print capabilities
of the system as well as collaborate with projects initiated by a Gold
or Silver user. Additional information on Aurigin appears on its Web site:
http://www.aurigin.com.
Aurigin has had
some recent financial difficulties, which led the company into Chapter
11 bankruptcy. The situation was resolved when MicroPatent acquired the
company at auction. Since the acquisition, MicroPatent has delayed the
launch of AOS 3.0, but plans to continue supporting existing customers
and continue offering access to the new AOS 2.5 offering. MicroPatent officials
have said that eventually its plans on merging the two services.
ClearForest
Inc.
The products from
ClearForest Inc. are among the most powerful text- mining tools available.
Most text-mining tools begin by performing what is called term extraction,
the process whereby the application selects relevant terms from within
the text and extracts them for subsequent analysis. Term extraction works
similar to the process used to create a full-text, inverted index of a
particular document. Once extracted from the text, the terms can be analyzed
in a number of ways. Information extraction extends the term extraction
operation; it not only selects terms, but subsequently categorizes them
automatically into pre-defined categories or taxonomies. It works on unstructured
text. There are no inventor fields or assignee fields with data specifically
tagged and classified. Information extraction techniques can analyze unstructured
text and automatically extract and categorize such information as people's
names, their positions, their companies, or various other attributes.
ClearForest has
developed two different tools for managing the information extraction process:
ClearStudio and ClearLab. ClearStudio uses a wizard-driven interface to
allow the user to quickly design language association rules for automatic
classification of information. ClearLab allows for the creation of association
rules as well, but it is a C + + driven interface designed for use by people
familiar with this programming language. For more information on information
extraction based on association, contact the ClearForest staff.
The third component
of the ClearForest suite is called ClearResearch. This application supports
the analysis of classified information. The tool allows for a number of
different analyses; one of the most powerful involves the use of circle
graphs to visualize the relationships between one collection of taxonomies
and another. A taxonomy, for instance, could cover all the companies named
within a document collection. Imagine a circle displaying technological
terms on the left-hand side and company names on the right. Lines of varying
thickness drawn from one side of the circle to the other would represent
relationships between a company and the technological terms associated
with it. Variations in thickness and color of the lines represent the intensity
of the relationship based on the total number of documents that support
it. Practitioners have referred to circle graphs as balls of string based
on their resemblance to the popular cat's toy. By double-clicking on a
line, users see the documents. Double-clicking on an individual technology
term or company name along the edge of the circle will cause a new window
to open with the clicked-upon object as the center and the subsequent terms
displayed around it as spokes. For instance, clicking on a company name
will open a new window with the company named at the center and spokes
leading off to the technology terms associated with the company. Right-clicking
on one of the technology terms in this window will bring up a contextual
menu that will allow an additional distribution on any of the taxonomies
available to the analyst. In this fashion, one can distribute the company's
inventors by the corresponding technology terms associated with them.
The ClearForest
suite contains many powerful text-mining features. Additional information
can be found at the Web site: http://www.clearforest.com.
Search Technology
Search Technology
produces VantagePoint, a data-mining tool that, for the most part, deals
with the statistical analysis of values within fielded data. If the field
happens to contain written text, then the tool applies natural language
processing algorithms to parse out topics. The first step in using VantagePoint
involves importing and parsing data from online records. Using the import
editor, fielded data from almost any source can be correctly parsed and
imported into the system for analysis. After creating a database with the
fielded values, the system provides tools for conducting list cleanup.
Using fuzzy logic routines, the system can help the user identify values
within the field that should probably be grouped together since the values
are synonymous with one another. Two of the most common uses for this feature
are the company name and inventor name cleanups. As mentioned, good statistical
analysis needs good, clean data. Often a time-consuming and laborious process,
the list cleanup features in VantagePoint can make the process easier.
The major statistical
paradigm used by VantagePoint is the co-ocurrency matrix. One attribute
is placed on the Y-axis, while another goes on the X-axis (see Figure
2 on page 34). Numbers show up within the matrix, indicating the
number of documents that incorporate the corresponding values on the X
and Y-axis. Clicking on a cell produces a list of the titles of the documents
that support this relationship. Synonymous values can be collected in a
group and compared to another field within the matrix. For instance, organizations
can be grouped by their general affiliation: industrial, governmental,
or educational. The user can then compare the number of documents produced
by each of the different organizational sectors within certain key technologies.
Along with co-ocurrency matrices, the system can also perform principal
components decomposition and create factor maps for any of the fields.
The system also provides pre-defined macros that allow the automatic selection
and exporting of a matrix into Microsoft Excel for visualization using
3-D graphs, line graphs, and various other charts. See the Web site [http://thevantagepoint.com]
for additional information.
IBM/Synthema
The Technology
Watch tool is a data-mining product originally developed by IBM (now marketed
by Synthema). Once it has the information fielded, Technology Watch will
cluster documents based on co-occurrence of exact string-matched data using
many-to-many relationships. In other words, it does not build silos using
one-to-one relationship whereby it would group all the documents containing
a unique code, and a document might end up in several different silos if
it contained more than one value for a particular field. Instead, the program
looks for documents that have a greater than 50 percent (this number can
be adjusted) homogeneity in the field analyzed and groups those documents
together in a bubble or cluster. The idea here is that if documents have
a high degree of similarity in the fields under analysis, they will likely
focus on a similar topic.
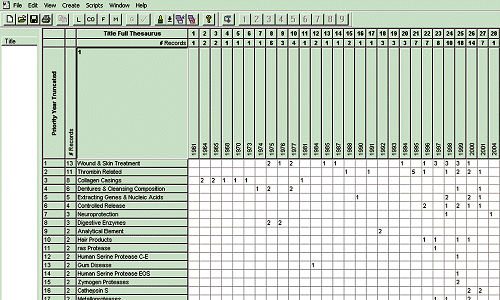
Figure
3 on page 34 shows a finished Technology Watch map on which patents
from a Cambridge, Massachusetts, pharmaceutical company called Vertex are
clustered based on their sharing of similar Derwent Manual codes. The bubbles
have been manually labeled, colored, and positioned by the analyst in order
to demonstrate collections of patents on the same topic. Lines drawn between
the bubbles indicate a relationship between the documents that had less
than a 50 percent homogeneity. The program automatically created these
lines.
Besides clustering,
Technology Watch can also provide statistics on any single field and demonstrate
which documents have a specified value for this field.
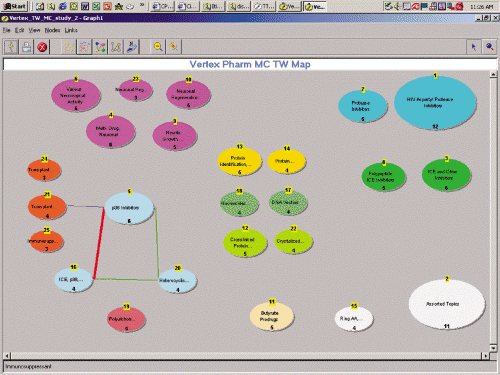
Invention
Machine Corporation
Invention Machine
Corporation produces a number of applications that assist in the computer-aided
invention process. With regards to patent analysis, however, its two most
relevant products are Co-Brain and Knowledgist. Both programs do basically
the same thing: extract subject/action/object (SAO) functions from full-text
data. The company has recently begun to refer to these functions as problem/solution
paradigms. The idea behind this approach is that patents are designed to
instruct readers on how to solve a practical problem. Think of the subject
and action as the solution and the object as the problem. For example,
if the object were to have clean clothes, the solution to the problem would
be washing with soap provided by the action and the subject. Once the
software has extracted the subject/action/object functions from documents,
it puts together the problems and solutions, grouping similar problems
together, so that users may compare different ways to solve a problem by
viewing them next to one another (see Figure 4
on page 34).
The two programs
differ in their scope and scale. Knowledgist is a desktop application that
can be used on personal datasets, while Co-Brain is designed to work from
a corporate server and act as a corporate knowledge portal. Both systems
come with a synonym tool that can greatly reduce the number of problem
solution sets created and greatly increase the system's ability to understand
when two different solutions solve the same problem. Both programs can
often create large problem/solution functions that are difficult to navigate
by scrolling up and down the list. To assist in identifying relevant functions,
a search button allows the user to find problems or solutions quickly.
Please see the Web site at http://www.invention-machine.com
for additional details.
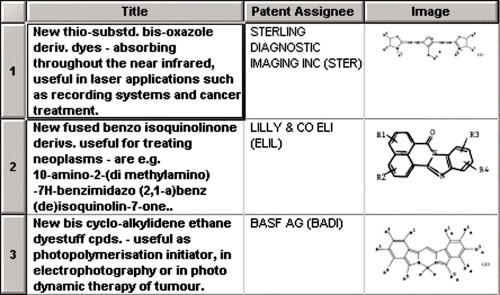
BizInt
BizInt produces
SmartCharts for Patents, tabulation software for patents. The software
allows a user to import patent data from the Derwent, IFI, and Chemical
Abstracts files on STN and create tables of information (including many
of the included images) from it. While not a text- or data-mining tool
per se, the software works well for formatting patent data for end-user
distribution. Tables are customizable, and one can even add columns to
keep track of comments made by people working together on a project. An
illustration of a portion of one of the SmartCharts tables appears in Figure
5 on page 39. For more information and additional examples of the
tables go to http://www.bizcharts.com/sc4pats.
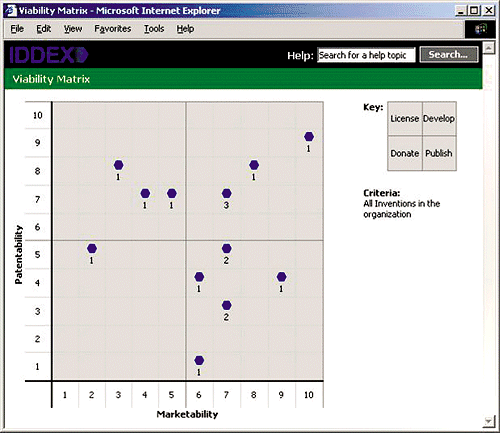
IDDEX Corporation
IDDEX Corporation
is a relatively new organization that offers a form of electronic notebook
for documenting innovation and invention disclosures. In the company's
own words, it offers a software platform and tools to manage the innovation
life cycle. As a software platform, one can use the system as an intranet
solution; as an ASP model, customers can go to a secure Web site to interact
with the system.
With a look and
feel similar to commonly used e-mail software, users can create new projects
or inventions and begin supporting these inventions with documents they
have created or received from others. The system catalogs contributors
and can help measure which individuals contributed what to the overall
invention. The platform also allows the tracking of disclosures related
to the invention and includes precise time stamping. Overall, the system
maintains a clear and detailed evidentiary trial that could become invaluable
if the invention were ever legally challenged.
After collecting
the information, the platform also provides analysis capabilities that
help licensing managers decide what portions of their portfolios to out-license
and which need further development. See Figure 6
on page 39 for an example.
OmniViz
One of the earliest
text-mining and visualization packages available was SPIRE from Battelle.
Members of the SPIRE development team spun off to form the company Cartia.
Cartia produced the ThemeScape tool discussed earlier in this article.
Another group of scientists at Battelle recognized that the SPIRE technology
could be used for more than straight text mining and began applying the
tool to biological and chemical datasets. This work again spun-off to create
another new company, OmniViz.
At its core, OmniViz
shares a number of similarities to ThemeScape, but the OmniViz staff have
made a number of improvements on the work done by Cartia/Aurigin. With
regards to text mining, OmniViz can import a large number of different
text formats and styles and recognize fielded text. This is important,
since when it comes to choosing what portions of a fielded record an analyst
wants to use for doing a cluster analysis, the system can distinguish key
portions of the text. For example, a fielded record might have fields for
inventor, assignee, title, abstract, and year published. With the OmniViz
system these different fields can be identified, the title and abstract
used for conducting a cluster analysis, and the remaining fields used on
the resulting visualization to call out interesting patterns, such as what
assignees have similar documents based on the similarity of their titles
and abstracts, or which subjects were published during which years. One
could perform some of these activities previously, but not with the power
and convenience found in OmniViz.
As mentioned, the
OmniViz developers did not stop at analyzing text, they also added functionality
to the system, enabling a biologist to analyze a large collection of cell
assay data, for instance, looking for drug candidates that share a similar
assay profile, even though very different structurally. The system also
allows the linking of two or more analyses that have elements in common.
This allows an analyst to identify trends using one type of data source
and analysis, while observing if a similar trend appears using a related
source and method.
Now while this
may not seem like a valid application when discussing patinformatics, it
actually raises some interesting possibilities. For instance, imagine if
one analysis shows clusters of molecules that are all active against one
member of a family of enzyme targets. A linked analysis of the drug candidates
clustered based on their chemical similarity shows that two of the potential
inhibitors have a similar structure, while a third is quite different.
Now, add in a third linked cluster analysis containing clusters of patent
and literature references that contain the drug candidates of interest.
Since the three analyses are linked, one could easily see that the two
similar compounds are actually covered in several relevant patents, while
the third compound is discussed in a literature reference. The ability
to collect and analyze data from biological, chemical, and text sources
and look for trends across all three sources makes OmniViz a unique tool.
A "Galaxy Map" from OmniViz appears in Figure 7
on page 39. For additional information, go to their Web site, http://www.omniviz.com.
The Metrics
Group/VxInsight
The Metrics Group,
a consulting firm, specializes in patent analysis, particularly patent
citation analysis (see patentcitations.com later in this article), but
it does other types of patent analysis projects as well. In April 2002,
the firm announced a partnership with the makers of VxInsight that allows
Metrics Group clients to use VxInsight to navigate citation analysis results
from the Metrics Group for a period of 6 months.
VxInsight was developed
at Sandia National Labs and provides visuals similar to those produced
by Aurigin's ThemeScape and OmniViz's ThemeMap. The tool allows Metrics
Group customers to see complicated co-citation links between a collection
of patent documents. Heavily co-cited patent documents appear raised on
the map for easy identification. The linkages between these documents and
others are also obvious.
Resources:
IFI U.S.
Claims
IFI is the organization
that media sources quote when ranking the companies with the highest number
of granted U.S. patents per year. This type of data, along with a number
of different types of statistics, appears in its Patent Intelligence and
Technology report. It provides detailed statistics on over 1,600 companies,
showing how their U.S. patenting activity (defined by broad U.S. and International
Patent Classes) has changed over the years. The report also contains distributions
of patents by company over the U.S. classification. IFI subscribers can
access the document from the IFI Web site or purchase a downloadable version
for subsequent uploading to a corporate intranet site. With the Web version,
a user can quickly look up a U.S. patent class of interest and discover
which organizations received the highest number of granted patents in that
class over the past year. Versions of the report can also be generated
with cumulative 5- and 10-year back files. For additional information,
try the IFI Web site: http://www.ificlaims.com.
Current-Patents
The British company
Current-Patents produces a number of different patent resources and publications.
For the most part, clients can browse these publications on a weekly or
monthly basis. In addition, the Drug Patents 2001 and Current Trends in
Pharmaceutical Discovery reports also contain data-mining and statistical
analyses of information from pharmaceutical patents.
The crown jewel
from Current-Patents is its new DOLPHIN database. DOLPHIN allows an analyst
to work with pharmaceutical patents in several different ways: by searching
for a patent number, by conducting a text search, or by looking up profiles
based on a drug or company name. The analytical capabilities are pre-defined
for each profile, but provide an interesting snapshot of how an organization
may compare to its competition. Some of the analytics include a chart of
drugs owned by the company with the highest patenting activity, drugs for
which the company has filed patents other than product or composition of
matter patents, patent classifications of the company vs. the industrial
average, therapeutic areas of the company vs. the industrial average, and
therapeutic areas by year and action. In the drugs owned by the organization
with the highest patenting activity chart, different colors represent new
use, component of combination, formulation, and various product or composition
of matter categories. The charts are built in Macromedia Flash and thus
are dynamic. When the user passes the cursor over a color on the bar, the
corresponding values for that percentage appear. Users can also click on
sections of the bars to go directly to those documents. For individual
drugs, some nice charts display patent classes and the company that filed
them. This view can give a user a quick overview of which companies work
with a particular drug substance and how they're doing. Interested users
can sign up for a demonstration account by registering at http://www.current-patents.com.
Web Sites
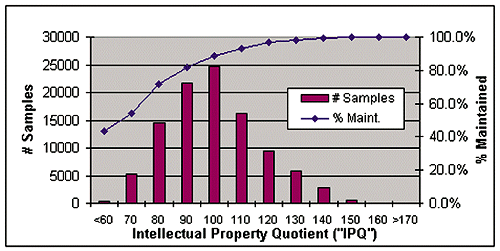
Patentratings.com
A relative newcomer,
the patentratings.com Web site offers an Intellectual Property Quotient
(IPQ) on patent documents. The score can be thought of as an IP version
of the well-known human Intelligence Quotient and is read in a similar
way, with a score of 100 being average. The site's authors calculate this
score by looking at patent metrics determined as statistically correlated
to patent maintenance rates. In a number of countries, after a patent grants,
the assignee must pay maintenance fees on a fixed future schedule in order
to keep the patent in force. The logic behind this product holds that patents
with maintenance fees kept up-to-date must have a greater value than the
ones allowed to expire for lack of payment. The owners would not continue
to pay maintenance fee if the IP did not have sustained value. Using regression
analysis and looking at over 40 individual patent metrics, the staff behind
patentratings.com claim to have a model that accurately predicts patent
value.
Figure
8 on page 40 shows a probability distribution of observed fourth
year maintenance rates vs. calculated IPQ scores for a sample population
of about 100,000 utility patents issued in 1996. This illustration shows
clearly that patents with an IPQ score of less than 60 have less than a
50 percent chance of being maintained at the first opportunity.
Patentcitations.com
One of the newest
patinformatics Web sites, patentcitations.com, created by The Metrics Group,
focuses on patent citation analysis. The site provides two different product
lines. Citation Bridge, a free service, is available when a client registers
at the site. It allows a user to generate a forward or backward citation
report from any U.S. patent back to 1980. The citation information displays
as a text-based report, not in a tree format as in citation reports from
Aurigin. The company is also considering generating forward and backward
citation reports for documents from countries other than the U.S. It is
not known at this time if these citation reports will also be offered free
of charge. Clearly, the owners of this site hope that the allure of free
backward and forward citation reports will attract customers to pay for
additional services.
The second product
line produces citation reports with more value-added using the Citation
Indicator Analytics (CIA) database, for which users pay a flat fee. The
CIA database is Web-enabled, using a Microsoft SQL-Server platform. Metrics
Group uses the CIA database internally to produce reports and generate
Citation Alerts, but may provide Web-based access within the next few months.
As opposed to the Citation Bridge, which can only handle one patent at
a time, CIA-based reports can run an entire group of patents. Examples
of the type of reports available include forward citation inventory, competitor
impact report, patent cousins, and corporate innovations flow. Additional
citation analyses the system can perform include a competitor historical
citation grid, speed of knowledge capture from patents, and external and
internal inventor historical citation grids.
The usefulness
of U.S. patent citations as an indicator of overall value has long been
debated and is still highly in doubt. Clearly, however, the reports available
from patentcitation.com do not focus on the inherent value of a patent,
but instead examine the relationships that patents have to one another
and the implied relationships that organizations have to each other when
either the organization or a patent examiner cites one document with respect
to another.
M-CAM DOORS
DOORS is marketed
as a tool for companies to help identify prior art and licensing opportunities
for their portfolios. The system works by combining advanced semantic analysis
with co-citation analysis. Documents that may be considered as relevant
prior art are selected based on patent citations they hold in common. In
addition, the system utilizes Latent Semantic Filtering (LSF) a process
in which documents with identical, or near-identical, concepts can be identified
whether or not the same words appear in each occurrence. LSF uses word
pairs and related nearby topics selected from the documents. Documents
are compared to one another based on not only the shared word pairs, but
also on the inclusion of similar nearby related topics. Combining the two
techniques allows easier identification of highly related patent references.
M-CAM employs a number of different visual displays to help analysts keep
track of a collection of patents concurrently.
The primary mode
of access is by subscription to the M-CAM Web site. Originally designed
for use by large financial organizations, the powerful system is also quite
expensive. Demonstrations can be arranged at the Web site: http://www.m-cam.com.
Wisdomain
Wisdomain is a
Korean company that has created a patent analysis site with three major
components: a search module, a citation module, and an analysis module.
The search module is populated with the databases normally expected in
this type of service patents from the U.S., Europe, WIPO, and Japan.
Searching is straight Boolean along with the ability to search selected
fields with the option to save search sets for later review and retrieval.
The citation module,
as the name implies, allows the user to work with citation information
from U.S. patents. The visualization allows for multiple nodes and the
identification of inner relationships between them. This visualization
helps to quickly identify core documents, those references that appear
to be at the crux of several branches. The diagram is interactive, so users
can drill down in patent nodes to quickly find additional information on
the reference.
The analysis module
contains a number of pre-configured charts and graphs. An analyst can quickly
get a top-level view of a document collection by seeing the patent count
by assignee, the International Patent Classification codes by assignee,
and a few additional charts and graphs.
Access to the system
involves subscription payments. For subscription details, go to http://www.wisdomain.com.
Delphion
and MicroPatent
Both of these
vendors have traditionally been viewed as patent document delivery companies.
Both are making strides toward integrating more analytics into their Web
sites. Delphion has always had text clustering and basic patent analytic
abilities, the first from its relationship with IBM, and the second based
on a tool purchased from Wisdomain called Patent Lab II. Both Delphion
and MicroPatent work with CHI Research to provide patent citation reports
to clients.
Delphion has recently
released a citation analysis tool called Citation Link. While not strictly
a hyperbolic tree, such as the citation tool available from Aurigin, the
tool does allow a user to identify a root patent and visually represent
backward and forward citation relationships to it.
Both organizations
have also added features to allow users to easily export fielded data to
Microsoft Excel for subsequent analysis and visualization. MicroPatent
recently added analytical reports and charts based on its data, along with
forward citation visualizations. MicroPatent has also acquired the assets
of Aurigin Systems Inc., as mentioned previously.
To check out these
respective Web sites, go to http://www.delphion.com
and http://www.micropatent.com.
Conclusion
The patentinformatics
field is constantly shifting. New practitioners are joining the field and
making contributions to the development of new methods for gleaning value
from patent data. Vendors already producing products and services within
this field change rapidly as well. Traditional patent information providers
are partnering with new companies or developing their own, new capabilities
to prepare the value-added indexing that they have spent years generating
for analysis and use in detailed and extensive data and text-mining experiments.
The field is sure to grow and advance in the years to come. Future practitioners
will certainly work with exciting new capabilities as the practice develops.
|