If you’re of a “certain” age, you’ll remember maps. Physical maps.
Enormous, brightly colored maps printed on decent paper (hopefully) that folded into thin strips (hopefully) and got you where you needed to go (hopefully.) You could tell how much someone traveled by how many maps they had stuffed in the glove compartment, or the back of the seat, or, occasionally, the trunk. They were the mark of the explorer, or at least the traveler.
Nowadays, you don’t see maps in glove compartments nearly as much. Drivers use Waze, or Google Maps, or, if they’re really old-fashioned, a standalone GPS device. Digital maps are easier to use; they’re always being updated; and you don’t have to fold them.
But while paper maps have become obsolete, digital mapping has gotten more popular. With the internet, maps aren’t for merely denoting places. They can track trends, time, or even hazards and risks. They can grow with the help of crowd sourcing, or surface information about the environment around you that you might not be aware of. Maps can even use AI to fill in “blanks” when not enough information is available. In this article I’ll take a look at 10 uses of maps online and how the territory they cover goes far beyond physical spaces.
 |
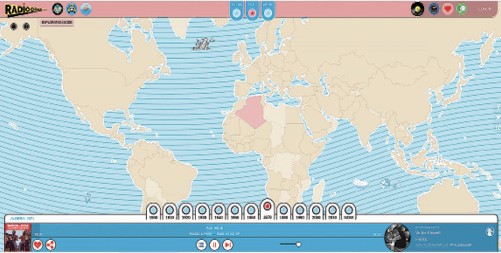
| Radiooooo maps countries and decades against music. |
Mapping Time, Space, and Music with Radiooooo
Every map includes multiple types of information. Even a basic road map includes information about not only roads but also parks, cities, memorials, and other information useful to the explorer. Radiooooo (radiooooo.com) takes advantage of its digital state to map countries and decades against music. All types of music, but you can specify slow, fast, or weird.
Using the website is simple. Click on a country, choose a decade (from the 1900s to now), and specify if you want fast music, slow music, or weird music. (Some countries are missing music for some decades or moods, but not enough t o make the tool unusable.) A map seems unnecessarily complicated for music, but this is an astounding discovery tool. It’s so easy to jump from fast music in 1970s Mongolia to weird music in 1920s Canada to a slack key slow jam in 1930s Hawaii. But if that’s not simple enough for you, Radiooooo offers other ways to browse its contents. Shuffle mode gives you a playlist of curated content from around the world, while Taxi Mode lets you specify multiple decades and countries. (I am here to confirm that choosing fast music from 1960s and 1970s African countries will have you dancing in your chair.) There’s even an Islands mode that lets you pick a thematic playlist.
Exploring Local Government
Using maps to explore music is entertaining. Using maps to display government policy and drill down into that policy on a nationwide level is illuminating. Information that might come across as downright stultifying in a report is easy to explore and compare when put on a map. That’s what LawAtlas’ Policy Surveillance Program is all about.
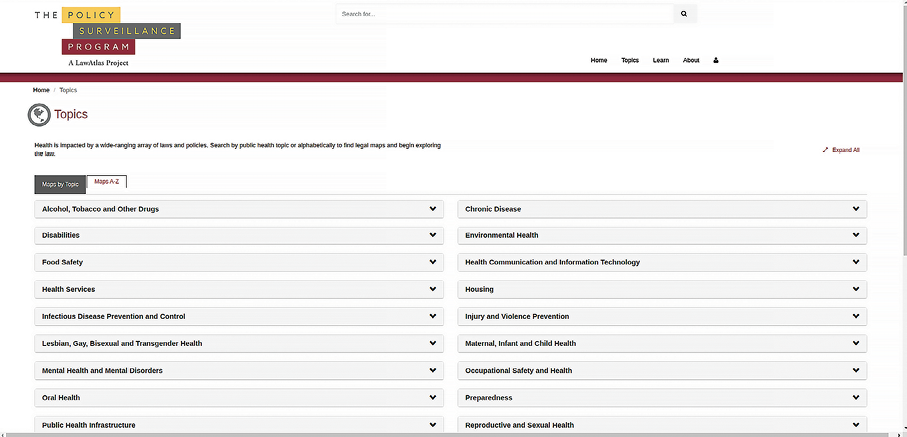
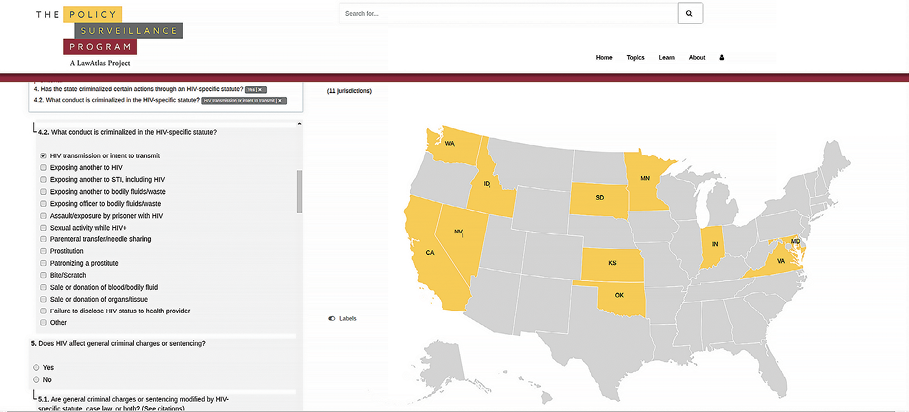
LawAtlas (lawatlas.org) lets you explore local government with its Policy Surveillance Program. From the landing page, you can choose from a huge selection of topics represented in maps, ranging from Accelerating the Implementation of International Health Regulations in the European Region to Youth Sports Traumatic Brain Injury Laws. A good example of using maps to both explore and filter data is the map HIV Criminalization by State.
 |
| The topic page for LawAtlas’ collection of maps covers many public health laws and policies. |
 |
| This LawAtlas map lets you click on a state to determine which states have criminalized certain actions by HIV-positive individuals. |
If you merely wanted to know a single state’s laws, you could click on the state and be done. But the LawAtlas map allows you to filter via a series of checkboxes on the left, drill down into the data, and quickly visualize the filter results. Want to see which states have criminalized certain actions by HIV-positive individuals, specifically, those transmitting HIV? It’s a matter of a few clicks.
The LawAtlas maps are a perfect mix of filters to drill down on legislative, local government minutia to instantly visualize what you’re looking at. What it’s mapping is known data. You can look up the laws yourself if you need to. But what if you’re exploring and finding a new set of data? Mapping it out can bring it to life.