FEATURE
Visualizing Networks of Scientific Research
by Chris Belter
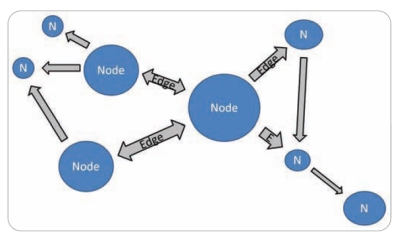
Map of a sample network showing nodes and directed edges |
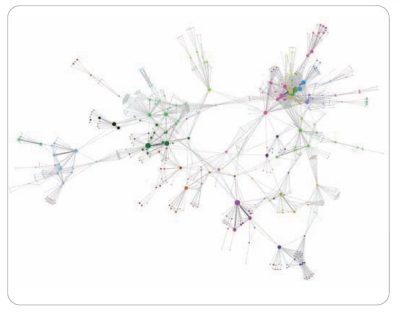
This image shows a co-author network generated from publications supported by NOAA’s Office of Ocean Exploration and Research (OER). Nodes are sized based on the number of publications produced and colored to highlight clustering. Edges are sized and colored based on the number of collaborations between authors. |
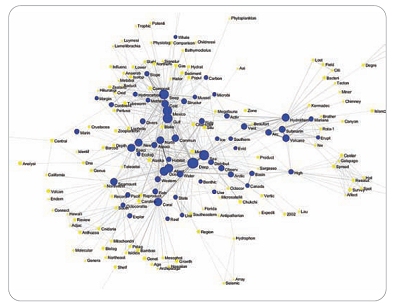
This image is a central section of a word co-occurrence network of words drawn from the titles of OER-supported journal articles. Some words have been truncated. Nodes are sized by the number of times the word is used and edges are sized and colored based on the number of publications in which they co-occur. Weaker edges have been removed for clarity. Nodes colored blue are those that have been used 10 or more times in the publication set. |
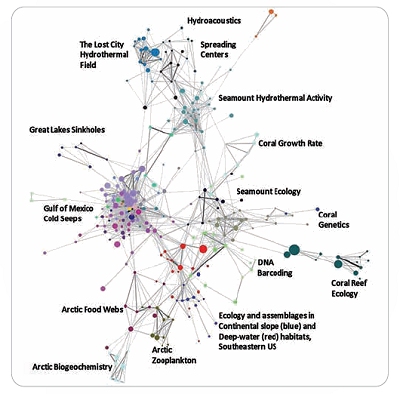
This image displays a bibliographic coupling network of journal articles supported by OER. Nodes are sized based on the paper’s citation count and colored to highlight clustering. Edges are sized and colored based on bibliographic coupling strength. Weaker edges have been removed for clarity. Labels were assigned to clusters based on manual inspection of the papers in each cluster. |
An institution’s ability to demonstrate the value of its mission, and its success in achieving that mission, has always been important. It becomes absolutely critical in challenging financial times such as the present. Proving your value is equally as important for scientific institutions and research organizations as it is to businesses. Rising costs of scientific research and shrinking research budgets means increased competition for a limited number of research grants. To compete effectively for funding, scientific institutions of all sizes need to be able to clearly and succinctly demonstrate the value of their research.
External peer review is the traditional measure for evaluating scientific research. Due to the substantial costs and limited scope of peer review, research institutions are increasingly turning to bibliometrics to supplement this process. Bibliometrics is the scientific analysis of publications that seeks to identify the major fields of study within and across scientific disciplines and the most influential publications, research institutions, and researchers in each of these fields. Despite some significant limitations of this approach, bibliometric analysis can supplement the peer-review process to demonstrate the value of scientific research.
Bibliometric mapping is particularly well-suited to doing this. By extracting relationships among publications, bibliometric mapping offers a method of quickly summarizing and then visualizing the structure inherent to a set of publications. The resulting visualizations, or maps, can be used not only to examine an institution’s past scientific research but also to identify potential future research directions and collaboration opportunities.
Network Science
Bibliometric mapping is one of the many applications of network science. To better understand bibliometric maps, it is useful to have a general understanding of network science. Network science is the study of how things relate to one another—the study of the relationships among members of a group. By studying the nature of these relationships and the overall structure of these networks, network science attempts to deduce the role of individual members and learn something about the nature of the network as a whole.
At its most basic level, a network consists of two variables—nodes and edges. Nodes represent the individual members of a group, and edges represent the presence of a relationship between two nodes. In a friendship network, for example, nodes represent people and edges represent the presence of a friendship between those two people. Consider the web: Nodes represent websites and edges represent the presence of hyperlinks from one website to another. Other networks can be as varied as actors co-starring in movies, electrical stations connected by power lines, and protein reactions within cells.
In more complex and representative networks, both nodes and edges can have specific characteristics associated with them. Depending on the network, both nodes and edges can have numerical values, belong to certain categories, or be of different types. Edges can also be either directed or undirected. Directed edges show the movement of something—electrical current or a web surfer, for example—from one node to another. Undirected edges simply indicate the presence of a relationship between nodes.
CREATING NETWORK MAPS
A visual representation, or map, of the entire network can be created once the network is constructed. In laying out the map, each node is positioned between other nodes to which it is connected by edges. This means that the absolute position of a node on the map is not meaningful, but its relative position is. Nodes that are more closely related are placed near each other, while nodes that are less related are placed farther away. In most modern visualizations, nodes are represented by shapes, such as circles, and edges are represented either as lines connecting the nodes or, in a network with directed edges, as arrows pointing from one node to another. Both nodes and edges can be sized and color-coded to represent different characteristics of the network.
In working with these maps, it is important to pay attention to the way that nodes form groups. Nodes in these groups, called clusters, are highly interconnected within the cluster but relatively weakly connected to the rest of the network. These clusters represent semi-autonomous communities, or subsets, of the larger network. It is also important to look past what shows on the map. The blank spaces on the map between nodes and clusters indicate the relationships or connections that have not yet been made. As with older geographical maps, think “Here be dragons”; blank spaces on the map indicate areas of potential opportunity waiting to be discovered.
Publication Networks
A bibliometric map, then, is the visualization of a network created from a set of scientific publications. Three basic types of networks can be created from these sets—collaboration networks, semantic networks, and publication citation networks. Within each of these three types, it is possible to create a number of additional networks depending on the specifics of how the networks are constructed.
Collaboration networks show the collaboration of authors, institutions, or countries in the production of scientific research. The most basic type of collaboration network is the co-author network, in which nodes represent authors and edges represent publications on which authors have collaborated. By extracting author affiliations and addresses from co-author networks, we can create institutional and country collaboration networks. Issues with name disambiguation and authority control plague all of these networks.
Semantic networks analyze the occurrence of certain words in a set of publications. The most common form of semantic networks is a word co-occurrence network. In this network, nodes represent words and edges represent the co-occurrence of those words in the same publication. Words used in these networks can be drawn from the full text of the publications in the set or, more usually, from the title, keywords, and/or abstracts of those publications. Words used in these networks are typically cleaned through truncation, and the removal of stop words before the network is generated, but these networks still suffer from issues with synonymy and homonymy.
Publication citation networks show the relationships among scientific publications based on their citations. There are three kinds of publication citation networks: direct citation, bibliographic coupling, and co-citation. Nodes represent scientific publications in all three of these kinds of networks; the difference is how the edges are created.
In a direct citation network, edges represent a direct citation from publication A to publication B. Direct citation networks are the simplest kind of publication citation network, but they are the least effective of the three in representing the actual structure of scientific research. In a bibliographic coupling network, an edge is drawn between two nodes if the publications represented by the nodes both cite the same previous publication(s). On the other hand, a co-citation network draws an edge between two publications if they are both cited by the same subsequent publication(s).
Using Bibliometric Maps
These three types of networks have different uses. Collaboration networks are particularly well-suited to identifying who created the publications in the set. A bibliometric map created from a collaboration network—in which nodes are sized based on publication or citation count and edges are sized based on the number of collaborations between nodes—allows the user to see the central authors or institutions represented in the network. Clusters of nodes in the map show both the research communities that coalesce around particular topics and the relationships among those communities. The map also shows the relationships or collaborations that have not been made: The lack of edges between adjacent nodes or clusters may represent opportunities for future collaboration.
On the other hand, publication citation and semantic networks are better at identifying what the publications in the set are about. A map of a semantic network, such as a word co-occurrence network, shows not only the most common words used in a publication set but also the relative centrality of those words. Words mapped at the center of the network tend to be those that are common to all of the publications in the set, while words near the edges of the map tend to be those used by a smaller subset of publications. Words at the edges of the map tend to form clusters of related words that, when taken together, describe the major research directions represented in the publication set.
Bibliometric maps created from publication citation networks are the most effective method of describing and evaluating a set of scientific publications. Nodes in these networks can be sized based on the number of citations each publication has received, and edges can be sized based on the strength of their citation similarity.
Like all real-world networks, publication citation networks form clusters. Since bibliographic coupling and co-citation networks are based on shared citations, and since publications that cite the same publications are likely to be about the same things, clusters formed in these networks represent research topics, while groups of clusters represent fields of study. A bibliometric map, then, shows both the number of publications and the impact of those publications, as measured by citation counts, in each research topic and field of study shown on the map.
OPPORTUNITIES FOR FUTURE RESEARCH
In addition to showing what research has already been done, bibliometric maps indicate opportunities for future research. Because they show the existing relationships among publications within a research topic, bibliometric maps also show, through blank spaces on the map, which connections within the topic have not yet been made.
Similarly, because bibliometric maps show the existing relationships between clusters and groups of clusters, blank spaces between clusters can point to the intertopical and interdisciplinary connections that have not yet been made. These connections could be single publications or even entire new research directions positioned in between those already shown on the map.
Findings from these different kinds of networks can be used in many ways. Collaboration networks can identify the most productive and highly cited authors, institutions, and countries in the publication set. Semantic networks can identify the concepts central to all publications in the set as well as those central to the various research directions represented in the set. Publication citation networks can identify the quantity and citation impact of publications in each of these research directions and disciplines.
Performing these analyses on a set of publications for a particular research topic provides a great deal of information about the structure and direction of research being done on that topic. Performing these analyses on publications produced by a research institution not only assists the institution in defining its past successes and future opportunities but also, when combined with targeted peer review, helps the institution demonstrate the value of its publication output and, by extension, the research that it conducts.
|

